

According to the Dodge Data & Analytics, commercial and multifamily construction starts increased by 4 percent to $212.4 billion in 2018.
At the New York NY metropolitan area, commercial and multifamily construction starts rose 10 percent to $28.7 billion in 2018 and continued to be the leading market in the U.S.
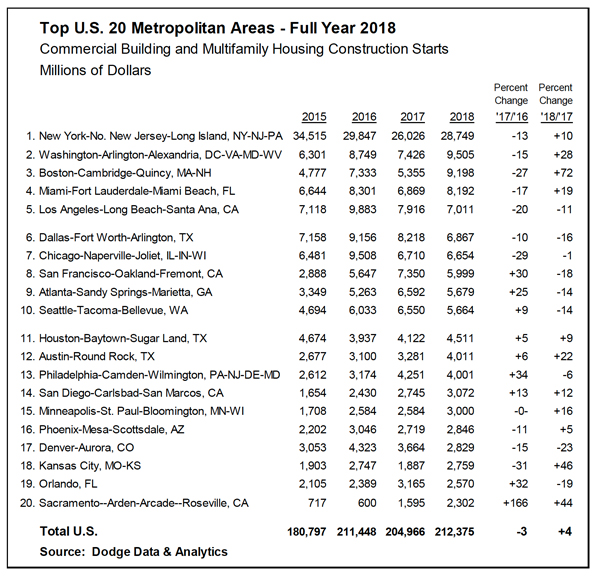
New York NY’s share of the U.S. total was 14% in 2018, up from 13% in 2017, although not as high as its peak 19% share reported in 2015.
The next three markets in the 2018 top ten all showed gains relative to 2017 – Washington DC ($9.5 billion), up 28%; Boston MA ($9.2 billion), up 72%; and Miami FL ($8.2 billion), up 19%. The remaining six markets in the top ten with their declines relative to 2017 were – Los Angeles CA ($7.0 billion), down 11%; Dallas-Ft. Worth TX ($6.9 billion), down 16%; Chicago IL ($6.7 billion), down 1%; San Francisco CA ($6.0 billion), down 18%; Atlanta GA ($5.7 billion), down 14%; and Seattle WA ($5.7 billion), down 14%.
U.S. Commercial and Multifamily Construction Starts
The New York NY metropolitan area, at $28.7 billion in 2018, continued to be the leading market in the U.S. for commercial and multifamily construction starts, advancing 10% after its 13% drop in 2017. New York NY’s share of the U.S. total was 14% in 2018, up from 13% in 2017, although not as high as its peak 19% share reported in 2015. The next three markets in the 2018 top ten all showed gains relative to 2017 – Washington DC ($9.5 billion), up 28%; Boston MA ($9.2 billion), up 72%; and Miami FL ($8.2 billion), up 19%. The remaining six markets in the top ten with their declines relative to 2017 were – Los Angeles CA ($7.0 billion), down 11%; Dallas-Ft. Worth TX ($6.9 billion), down 16%; Chicago IL ($6.7 billion), down 1%; San Francisco CA ($6.0 billion), down 18%; Atlanta GA ($5.7 billion), down 14%; and Seattle WA ($5.7 billion), down 14%.
For the metropolitan areas ranked 11 through 20, the seven showing greater activity in 2018 relative to 2017 were – Houston TX ($4.5 billion), up 9%; Austin TX ($4.0 billion), up 22%; San Diego CA ($3.1 billion), up 12%; Minneapolis-St. Paul MN ($3.0 billion), up 16%; Phoenix AZ ($2.8 billion), up 5%; Kansas City MO-KS ($2.8 billion), up 46%; and Sacramento CA ($2.3 billion), up 44%. The three metropolitan areas in this group with decreased dollar amounts of commercial and multifamily starts in 2018 were – Philadelphia PA ($4.0 billion), down 6%; Denver CO ($2.8 billion), down 23%; and Orlando FL ($2.6 billion), down 19%.
The commercial and multifamily total is comprised of office buildings, stores, hotels, warehouses, commercial garages, and multifamily housing. Not included in this ranking are institutional building projects (e.g., educational facilities, hospitals, convention centers, casinos, transportation terminals), manufacturing buildings, single family housing, public works, and electric utilities/gas plants.
SEE ALSO : U.S commercial and multifamily mortgage maturity volumes to rise 8 percent in 2019


